12 new rail lines, 104 km of new track, and a decade-long construction program targeting Korea’s most rail-deprived major province.
Source: 제2차 경기도 도시철도망 구축계획(안) (2026–2035), Official Report, December 2025 · For informational purposes only. Not investment advice.
1. The Opportunity: Korea’s Most Rail-Deprived Major Province
Gyeonggi-do is South Korea’s most populous province, home to over 13.4 million residents today — a figure projected to peak at 14.45 million by 2035. Despite surrounding Seoul on three sides and hosting some of the country’s most important industrial and technology corridors, its rail infrastructure is dramatically underdeveloped relative to its population.
The core problem, in one number:
| Region | Rail Modal Share (2021) |
|---|---|
| Seoul | 15.5% |
| Gyeonggi-do | 3.9% — only one-quarter of Seoul’s |
Residents of Gyeonggi overwhelmingly rely on private cars and roads — a situation the provincial government has formally declared unsustainable. The 2nd Gyeonggi-do Urban Rail Network Construction Plan is the official, government-approved 10-year response to close this gap.
2. The Plan: 12 Lines, One Vision
The plan covers a 2026–2035 construction window and represents one of the largest sub-national transit investments in Korean history. All 12 lines were selected through a rigorous multi-criteria analysis including B/C (benefit-to-cost) ratios and an AHP (Analytic Hierarchy Process) composite score covering economics, policy alignment, and regional equity.
The minimum bar for inclusion: B/C ≥ 0.7 OR AHP ≥ 0.5. Every line in the table below clears that threshold.
| Rank | Line Name | District | Length | B/C Ratio | AHP Score |
|---|---|---|---|---|---|
| 1 | Gimpo Goldline Hagun Extension | Gimpo | 7.04 km | 0.91 | 0.572 |
| 2 | Pangyo-Opo Line | Seongnam / Gwangju | 9.50 km | 0.82 | 0.567 |
| 3 | Wolgot-Baegot Line | Siheung | 5.50 km | 0.79 | 0.549 |
| 4 | Dongbaek-Sinbong Line | Yongin | 14.70 km | 0.78 | 0.541 |
| 5 | Suwon City Rail Line 1 | Suwon | 6.72 km | 0.72 | 0.534 |
| 6 | Gajwa-Siksa Line | Goyang | 13.37 km | 0.74 | 0.529 |
| 7 | Moran-Pangyo Line (Metro Line 8 Ext.) | Seongnam | 3.94 km | 0.75 | 0.526 |
| 8 | Yongin Line Extension | Yongin | 6.80 km | 0.70 | 0.525 |
| 9 | Seongnam City Rail Line 2 | Seongnam | 16.86 km | 0.73 | 0.515 |
| 10 | Daegok-Goyang-Siksa Line | Goyang | 6.25 km | 0.49* | 0.501 |
| 11 | Seongnam City Rail Line 1 | Seongnam | 9.90 km | 0.63 | 0.500 |
| 12 | Dukjeong-Ojeong Line | Yangju | 3.90 km | 0.81 | 0.490 |
* Daegok-Goyang-Siksa qualified via AHP score despite B/C below 0.7, reflecting strong policy and regional equity value.
3. Where the Money Comes From
The plan’s financing structure distributes cost across three levels of government, with the central (national) government shouldering the largest share — a strong signal of top-level political commitment.
| Funding Source | Amount (KRW) | Share |
|---|---|---|
| National Government | ~₩4,273.5B | ~58.8% |
| Local Governments (combined) | ~₩2,798.6B | ~38.5% |
| — Gyeonggi-do Province | ~₩139.9B | ~1.9% |
| — Individual Cities / Counties | ~₩2,658.7B | ~36.6% |
| Concession / Private | ₩150.0B | ~2.1% |
| TOTAL | ~₩7,272.5B | 100% |
The national government’s dominant share reflects that these lines are part of Korea’s national urban rail strategy, with Ministry of Land approval required at every stage — not just a provincial political project.
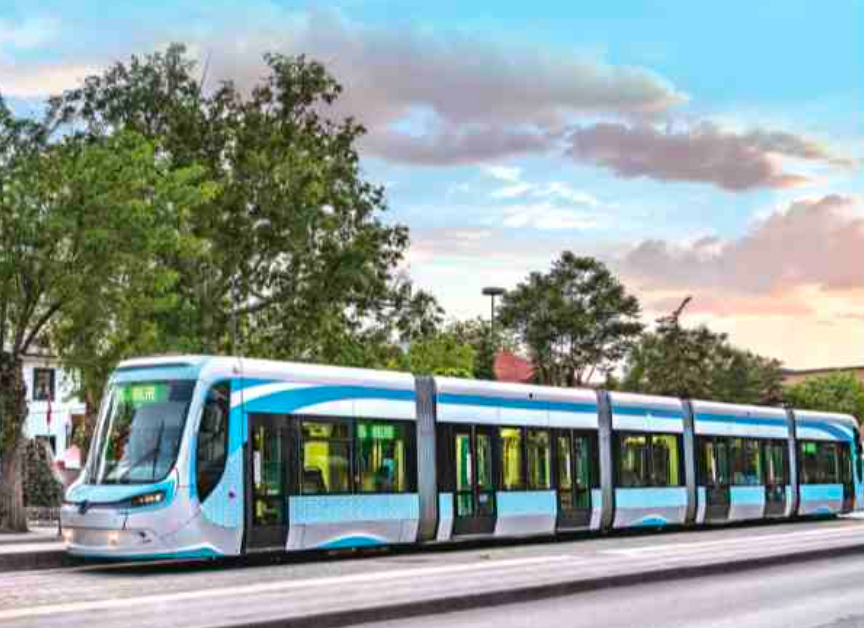
4. Technology Choice: Cost-Effective Trams vs. Underground Rail
The plan’s heavy use of trams (LRT running on surface streets) dramatically reduces construction costs per kilometer compared to conventional underground rail.
| Metric | Tram — Gajwa-Siksa Line | Underground AGT — Gimpo Goldline |
|---|---|---|
| Total Cost | ₩411.1B for 13.37 km | ₩739.5B for 7.04 km |
| Cost per km | ~₩30.7B / km | ~₩105B / km |
| Capacity | 246 passengers (5-module) | 230 passengers (2-car) |
| Construction Type | Surface / above-ground | Underground |
5. Critical Risk: Municipal Fiscal Capacity
The plan’s most significant implementation risk is the financial readiness of the municipalities that must co-fund the lines. The official report’s own fiscal analysis reveals notable shortfalls across multiple cities.1,2
| City | Fiscal Capacity Rating1 | Funding Plan Adequacy2 | Key Lines Affected |
|---|---|---|---|
| Seongnam | ✓ Adequate | ⚠ Insufficient | Lines 1 & 2, Moran-Pangyo |
| Yongin | ✓ Adequate | ⚠ Insufficient | Yongin Extension, Dongbaek-Sinbong |
| Gimpo | ✓ Adequate | ⚠ Insufficient | Goldline Hagun Extension (#1 ranked) |
| Suwon | ⚠ Weak | ✓ Adequate | Suwon City Rail Line 1 |
| Goyang | ⚠ Weak | ✓ Adequate | Gajwa-Siksa, Daegok-Goyang-Siksa |
| Gwangju | ⚠ Weak | ✓ Adequate | Pangyo-Opo Line |
| Yangju | ⚠ Weak | ✓ Adequate | Dukjeong-Ojeong Line |
| Siheung | ✓ Adequate | ✓ Adequate | Wolgot-Baegot Line |
Two lines were already excluded from the official plan specifically due to funding constraints: the Dongtan-Suwon Extension (insufficient funding from Suwon) and the Byeongjeom-Bongdam Line (deferred pending area development confirmation). This confirms that funding gaps are a real execution risk, not a theoretical one.
6. What Gets Built and When
| Phase | Activity |
|---|---|
| 2025 (Complete) | Official plan report published; national government review begins |
| 2026–2028 | Public hearings, Ministry of Land approval, detailed engineering design per line |
| 2028–2035 | Active construction across the 12 lines |
| Post-2031 | Earliest lines begin commercial operations; ridership and revenue analysis |
| 2035 Target | All 12 lines operational — rail network expanded from 163.9 km to 268 km (+64%) |
7. The Investment Thesis
Demand is Structural, Not Cyclical
Gyeonggi-do’s population growth is driven by planned satellite city development (3rd-generation new towns including Changneung). The commute problem these lines solve worsens without investment — it doesn’t self-correct.
Political Will is High and Multilateral
National government approval is required, national funding covers nearly 59% of costs, and the Ministry of Land has been involved since the 1st plan (2019). Abandonment risk is low for high-ranked lines.
The B/C Leaders Are the Safest Bets
The Gimpo Goldline Extension (B/C: 0.91), Pangyo-Opo Line (0.82), and Wolgot-Baegot Line (0.79) offer the strongest economic return profile. The Gimpo line extends an already-operational line — lower greenfield risk.
Tram Adoption Opens a Supply Chain Opportunity
The plan’s preference for domestically developed tram vehicles and low-cost LRT creates opportunities for Korean rail manufacturers, engineering firms, and specialized construction companies.
Real Estate Near Stations Will Benefit
The plan connects directly to residential and industrial development zones (Techno Valley, 3rd New Town areas, R&D clusters). Stations serving currently rail-deprived areas — particularly in Goyang and Yangju — represent the highest-upside land value plays.
8. Key Risks to Monitor
- Municipal co-funding shortfalls — especially in Seongnam, Yongin, and Gimpo — may delay or restructure individual line timelines.
- The Daegok-Goyang-Siksa Line faces a route conflict with the Goyang-Eunpyeong Line and the Ilsan Line Extension that requires resolution before construction can proceed.
- National government approval is still pending; the plan requires formal Ministry of Land sign-off and review by the National Transport Committee.
- Ridership projections peak around 2025 for the overall Gyeonggi travel market, then gradually decline. Lines with lower B/C ratios carry more revenue risk if population growth underperforms.
- Construction timelines in Korea’s transit sector have historically extended. Investors should model a 12–15 year horizon rather than assuming the 2035 target is firm.
Bottom Line
Gyeonggi-do’s 2nd Rail Plan is a large, government-backed, nationally funded infrastructure program solving a real and growing mobility problem for Korea’s most populous province. The top-ranked lines are economically justified. The primary risks are municipal financing capability and approval timelines. Investors with exposure to Korean infrastructure construction, urban real estate near new station corridors, or domestic rail manufacturing stand to benefit most.
Footnotes
Fiscal Capacity Rating measures a city’s overall financial health using three indicators: fiscal self-reliance ratio (own revenue as a share of total budget), fiscal strength index (ability to fund basic services independently), and debt repayment ratio — all benchmarked against the average for cities of similar size. A “Weak” rating means the city falls below peer averages on one or more of these measures, indicating structural fiscal fragility regardless of any specific project.
Funding Plan Adequacy is a forward-looking, project-specific test. It asks whether a city’s projected annual rail co-funding contributions — over the 40-year construction and operation period — stay within its historical spending capacity ratios (measured as annual rail outlay as a percentage of own revenues and available capital budget). A city can pass this test even with weak overall finances if its specific rail commitment is modest, and can fail it despite healthy finances if it has multiple expensive lines to fund simultaneously.
